
WATER DATA FOR TEXAS
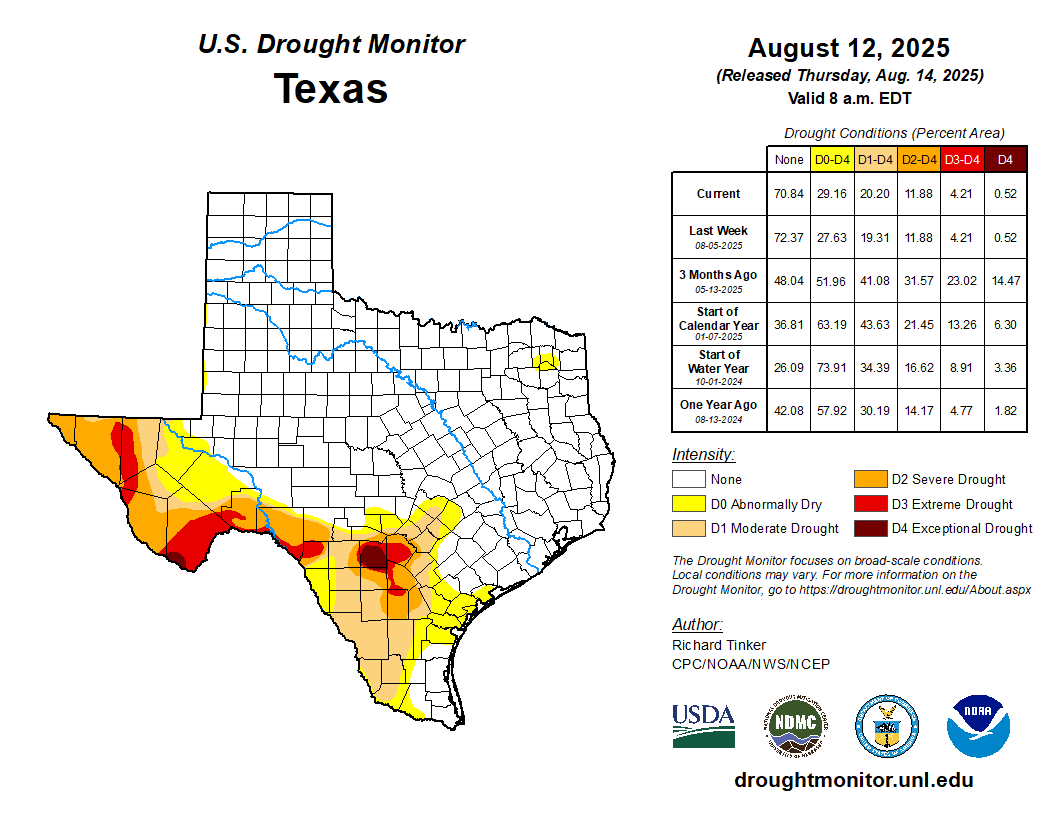
The U.S. Drought Monitor, established in 1999, is a weekly map of drought conditions that is produced jointly by the National Oceanic and Atmospheric Administration, the U.S. Department of Agriculture, and the National Drought Mitigation Center (NDMC) at the University of Nebraska-Lincoln. The U.S. Drought Monitor website is hosted and maintained by the NDMC.
U.S. Drought Monitor maps are released every Thursday at 8:30 a.m. eastern time, and are based on data recorded up to 7 a.m. the preceding Tuesday. The weekly map is based on measurements of climatic, hydrologic and soil conditions, as well as reported impacts and observations from more than 350 contributors around the country. Eleven climatologists from the partner organizations take turns serving as the lead author producing the map each week. The authors examine all the data and use their best judgment to reconcile any variances in what different sources report. The U.S. Drought Monitor is a composite index that includes many indicators.
For more data and information, visit the U.S. Drought Monitor.
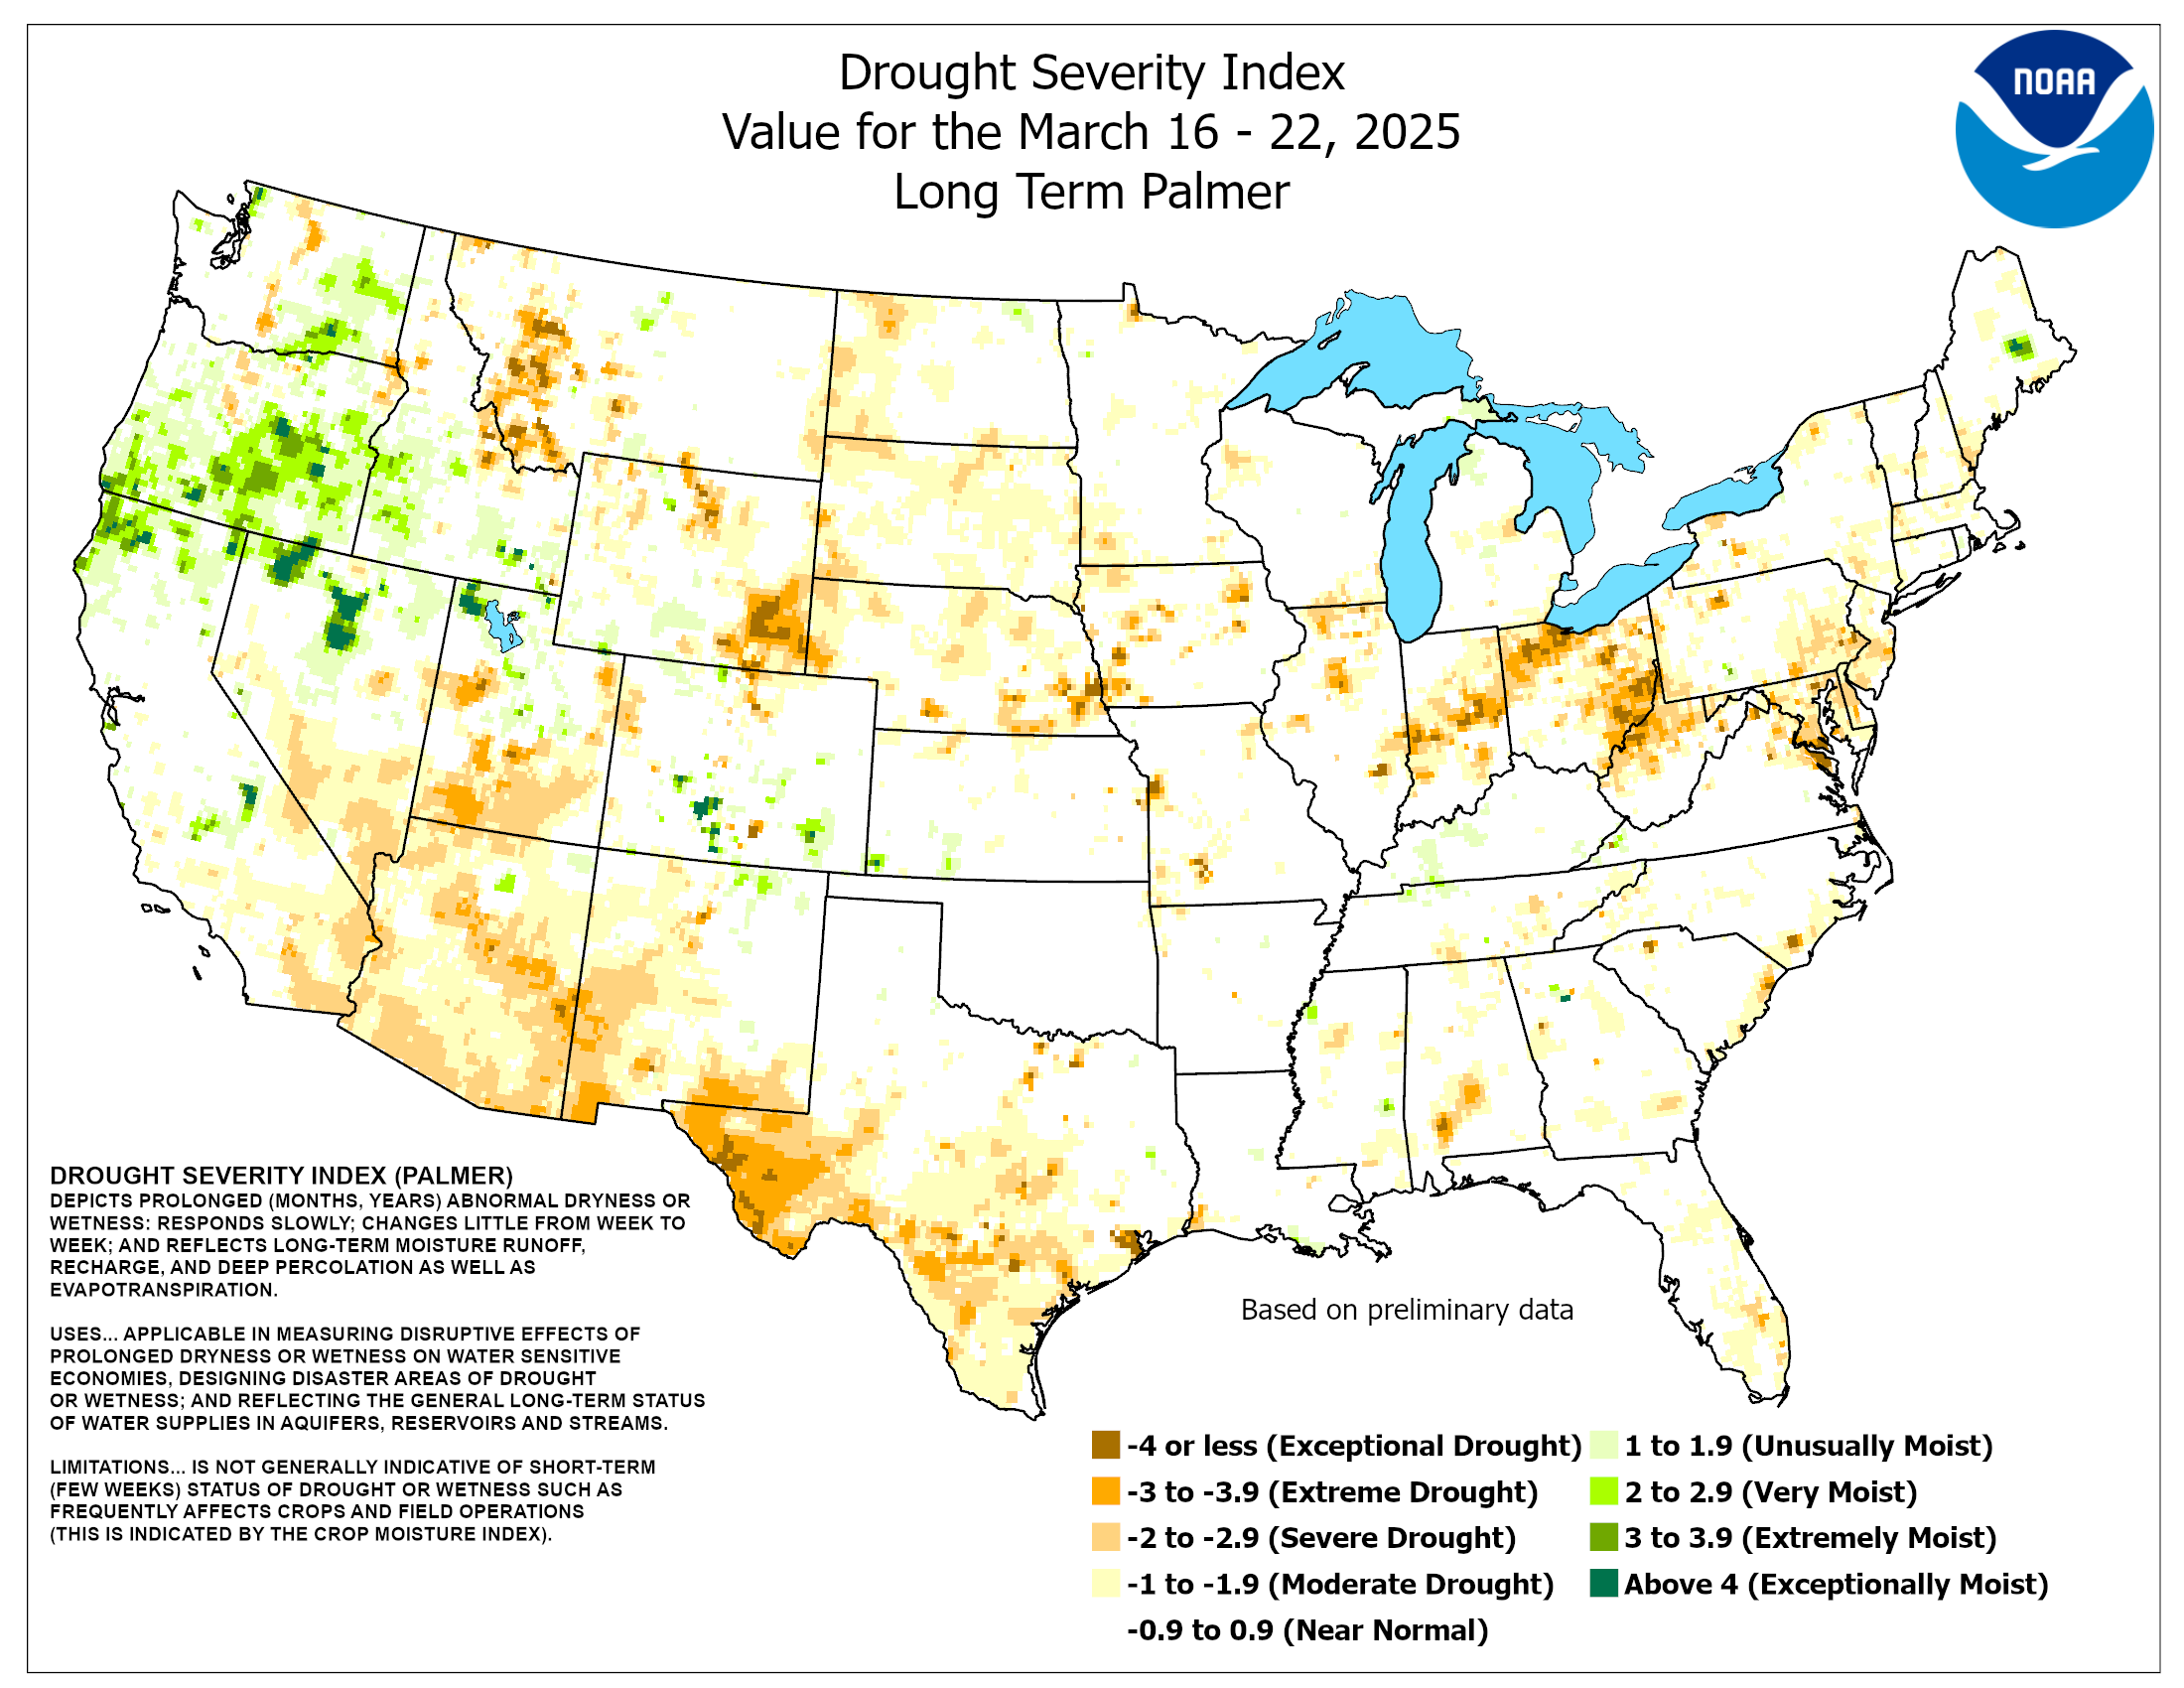
Palmer Drought Severity Index (PDSI).
The PDSI is updated weekly by the Climate Prediction Center. It is based on rainfall, temperature and historic data, and is computed based on a complex formula devised by W.C. Palmer in 1965. One advantage of the PDSI is that as a strictly numeric product, PDSI values can be computed back to the beginning of the historic record. Disadvantages of the PDSI are that it is slow to detect quick-onset droughts, and does not reflect snowpack, an important component of water supply in the western United States.
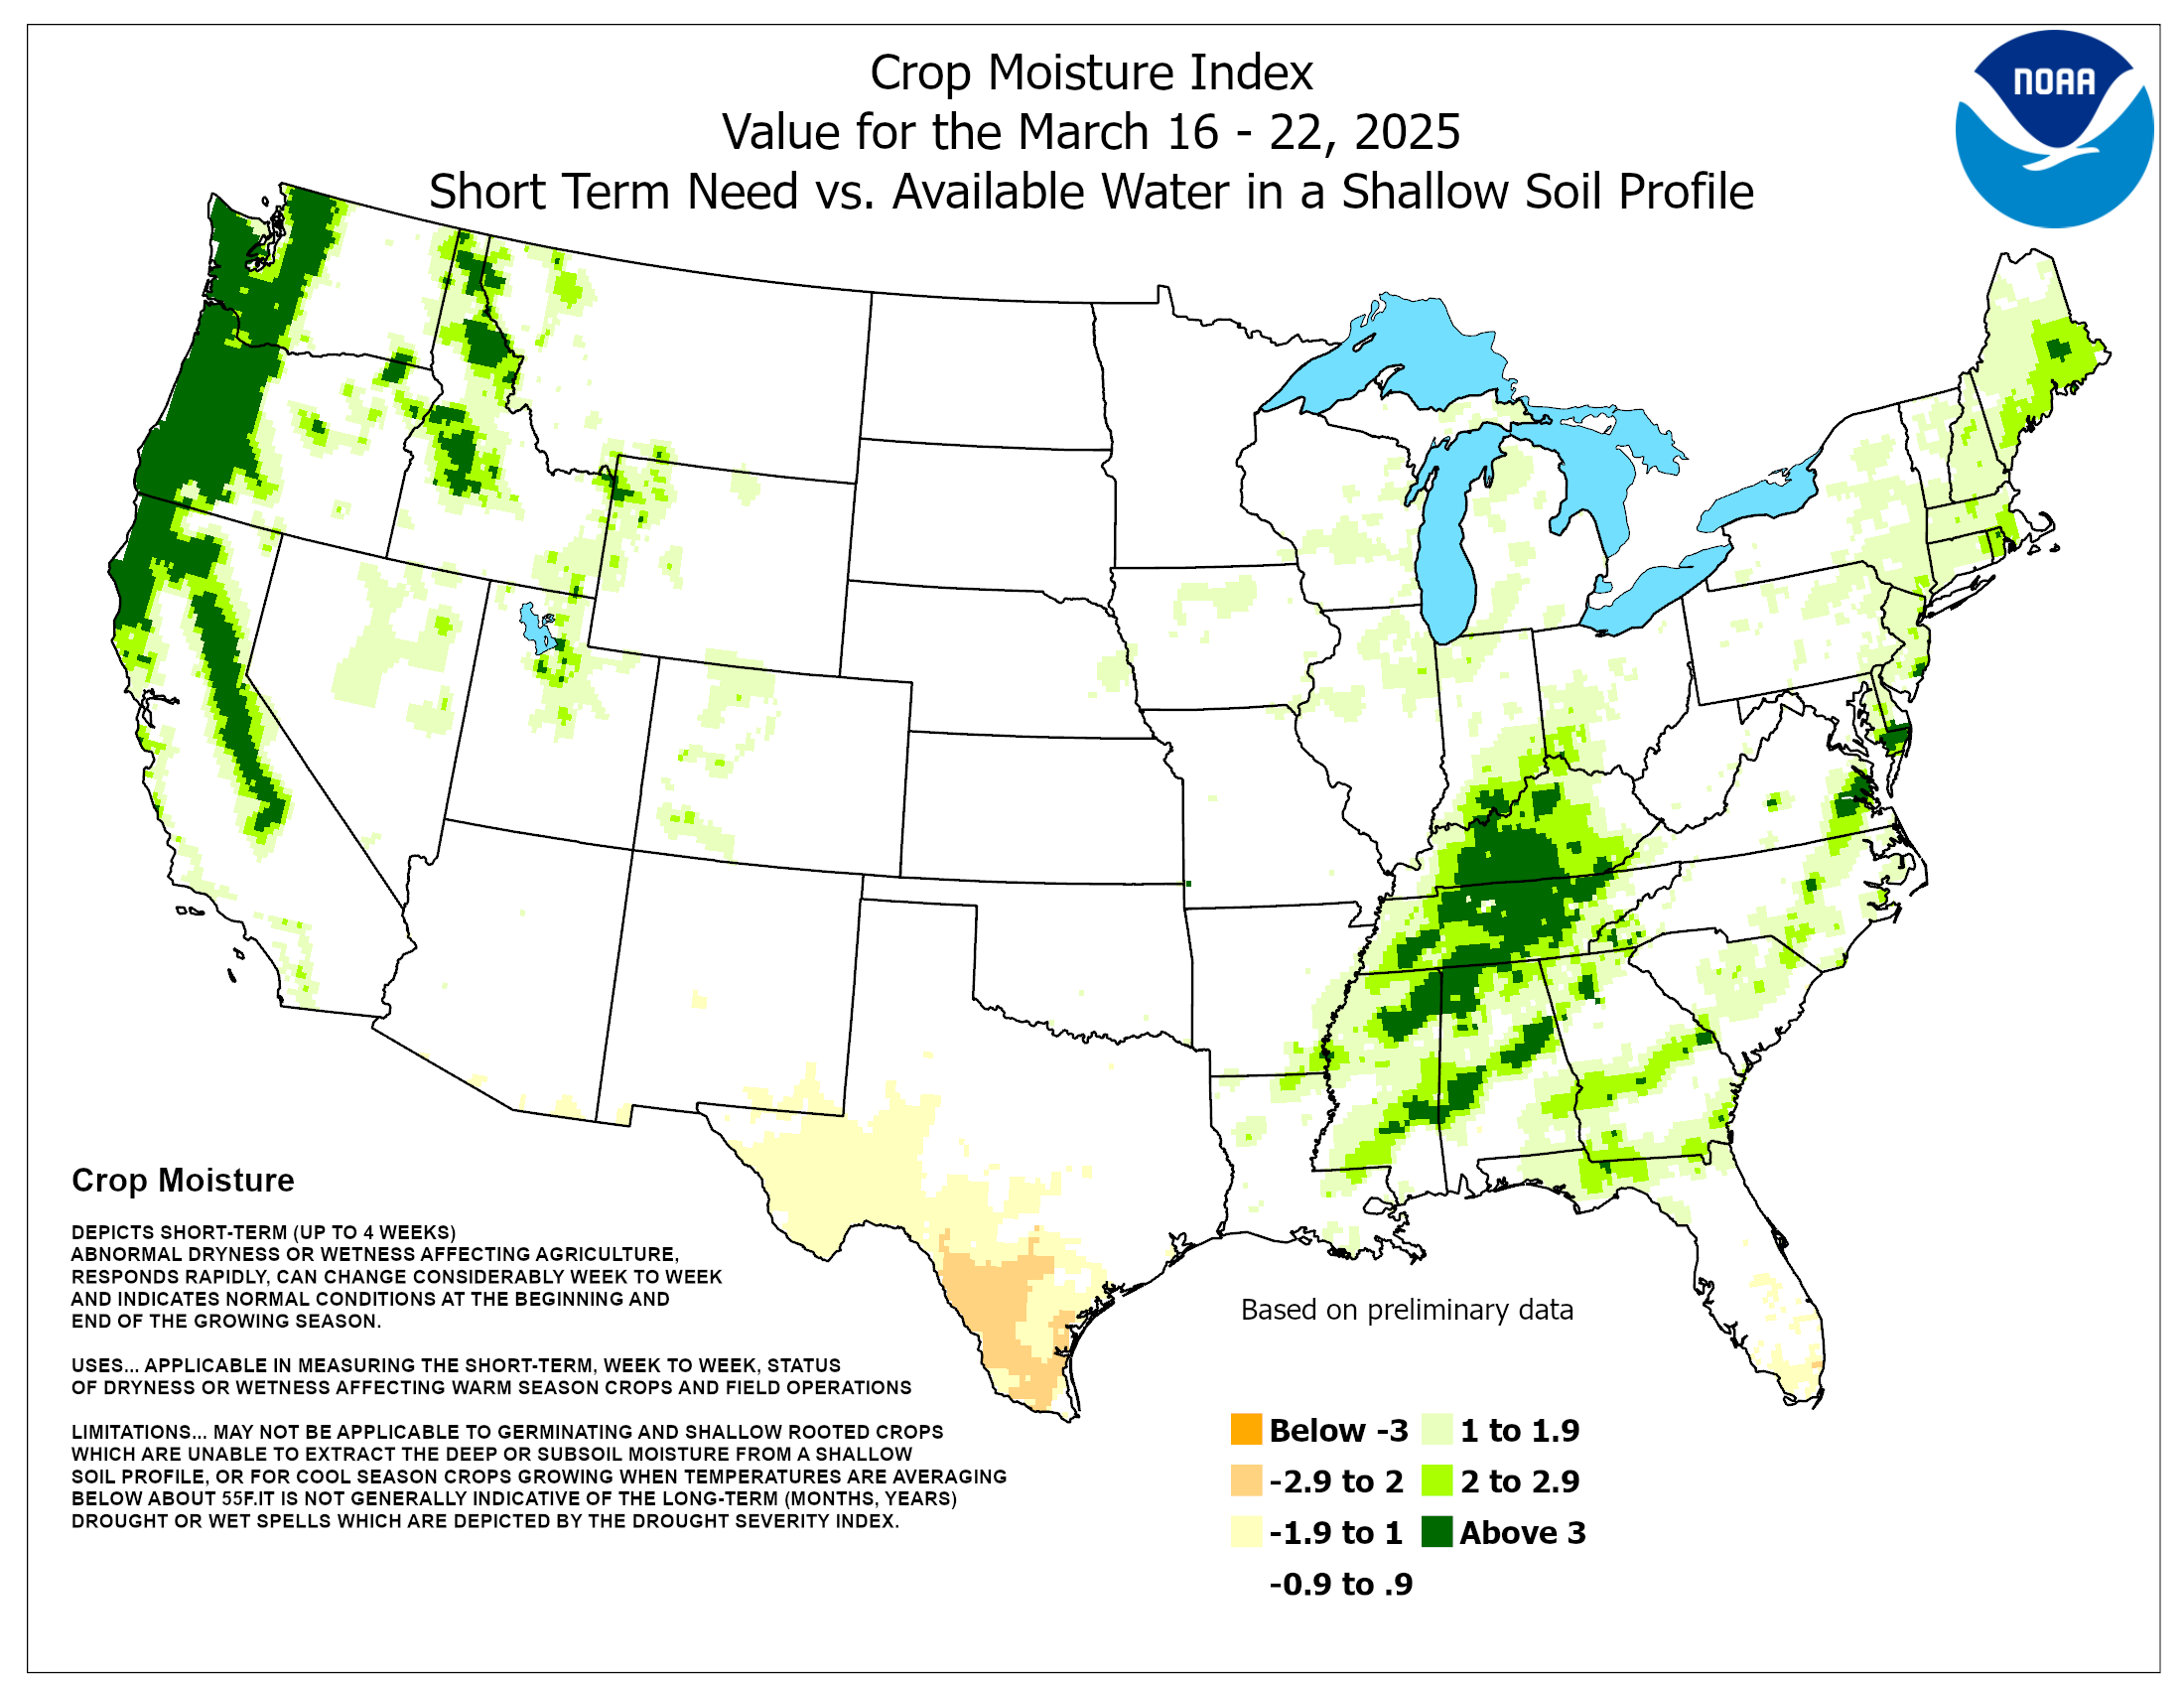
Crop Moisture Index.
The Crop Moisture Index, updated weekly by the Climate Prediction Center, is a derivative of the Palmer Drought Index, designed to reflect quickly changing soil moisture conditions.
